
FREE PUBLIC PRACTICE · NO SIGN-IN REQUIRED
SQL JOIN fan-out: find and fix double-counted totals
Practice diagnosing duplicated totals after a SQL JOIN. Compare table grain, test row counts, and repair a small orders-and-items query.
Original READY self-study material. Your work stays in your own document; this page does not save, grade, award credit or change READYScore.
What you will practise
- Explain why a one-to-many join repeats order-level values.
- Choose an aggregation grain that preserves the business measure.
- Reject a DISTINCT shortcut using a counterexample.
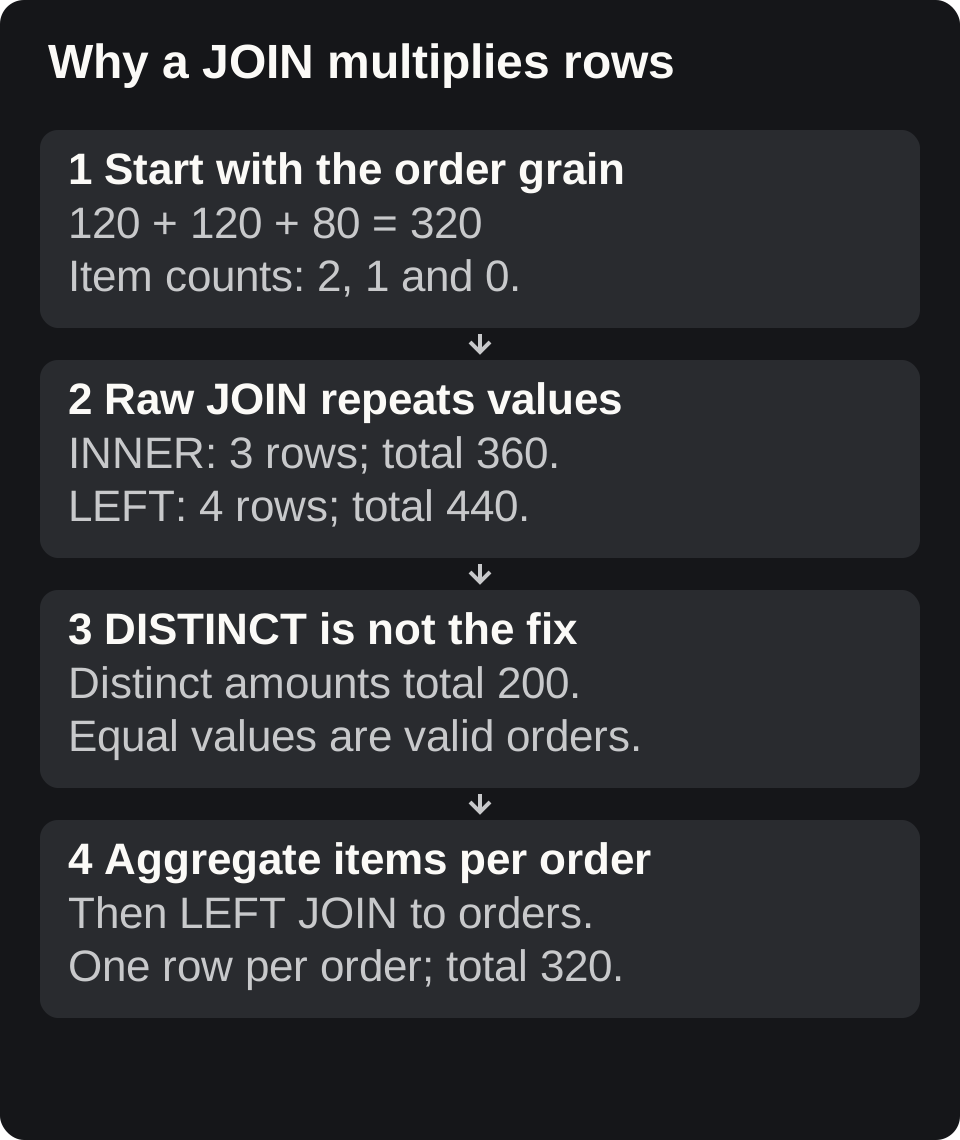
Start with the unit of one row
A dashboard can run without an error and still answer the wrong question. In this original practice case, the business asks for total order value. The orders table contains one row per order; the items table contains one row per line item. Those are different grains. Joining them creates one row per matching item, so an order amount may appear several times. Before choosing SQL syntax, write the unit of each input row and the unit of the requested result.
For a qualified inner join, PostgreSQL produces a result row for each right-side row that matches a left-side row. A left join also retains unmatched left rows. That behavior is useful, but it does not make an order-level amount safe to sum after a one-to-many match. The exercise below uses deliberately small fictional data so you can inspect every result row.
Repair the measure before making the chart
If the question needs only total order value, sum the orders table directly. If the report also needs item counts per order, first group items by order_id, then left join that one-row-per-order result to orders. The amount remains at order grain, and a missing item count can be displayed as zero only because this fictional source defines an absent item row as no recorded items. Do not generalize that convention to an incomplete production feed.
Inspect the intermediate output, count distinct order identifiers, and compare the repaired sum with the independently calculated 320. Add a second order with the same amount to prove the query does not rely on DISTINCT amounts. Add an unmatched order to test inclusion. A correct query should express the requested measure and survive these predictable cases.
Your practice task
Download the SQL lab and run it in a disposable SQL environment. Record each table grain, the inner-join and left-join row counts, and the totals produced by the broken queries. Write a corrected report showing order ID, order amount, and item count. Explain why one row per order is the right intermediate grain for this report.
Then assess this AI suggestion: “Use SUM(DISTINCT order_amount) to remove the duplicates.” Give a counterexample from the supplied data and explain the underlying mistake. Finally, change the request to total item quantity. Identify which source column and grain now matter; an order-value query cannot be reused merely by changing its title.
Check your reasoning
A defensible explanation identifies both repeated values and excluded records, preserves all three order IDs, and reconciles to 320. It distinguishes a legitimate same-valued order from a duplicated join row. Your final explanation should state what missing item rows mean in this exercise and what you would verify before applying that assumption elsewhere.
This is a self-directed practice exercise, not a graded certification exam. It does not record course completion, award credit, or change READYScore. Continue with the parent course when you are ready.
Worked example: a total that grows after a join
Orders O101 and O102 are each worth 120; O103 is worth 80. O101 has two items, O102 has one, and O103 has no recorded items. The total across orders is 320. An inner join produces three rows: O101 appears twice and O102 once. Summing order_amount in those rows reports 360 while also dropping O103. The error combines duplication and exclusion; checking only the final row count would miss that distinction.
A left join retains O103 and produces four rows, but SUM(order_amount) becomes 440. Changing the join type repairs missing orders without repairing repeated amounts. SUM(DISTINCT order_amount) is also wrong: the two legitimate 120 orders collapse into one amount, yielding 200. DISTINCT knows values, not your business definition.
WITH item_counts AS (SELECT order_id, COUNT(*) AS item_count FROM items GROUP BY order_id) SELECT o.order_id, o.order_amount, COALESCE(i.item_count, 0) AS item_count FROM orders o LEFT JOIN item_counts i ON i.order_id = o.order_id;| Order | Amount | Recorded items |
|---|---|---|
| O101 | 120 | 2 |
| O102 | 120 | 1 |
| O103 | 80 | 0 |
Put it into practice
Complete the exercise
- Download the SQL lab and run it in a disposable SQL environment. Record each table grain, the inner-join and left-join row counts, and the totals produced by the broken queries. Write a corrected report showing order ID, order amount, and item count. Explain why one row per order is the right intermediate grain for this report.
Table grain:
Broken result:
Corrected query:
Counterexample:
Limitation:
Download the practice files
Review your reasoning
Try the exercise first, then open these self-review hints. They are guidance, not an assessment result.
Did you preserve all order IDs and distinguish duplicated rows from equal values?
Reconcile to the orders table, then test another equal-valued order.
Independent learning, clear boundaries
Original independent READY learning. Not official Google or Coursera training or endorsed by either provider. All scenario data are fictional. This resource does not award a Google Professional Certificate, READY certification, course credit or READYScore. Written practice is self-reviewed, not automatically graded; this public page has no account save, submission or reward function.
These exercises use fictional examples. They do not replace production authorization, provider credentials, professional advice or certification requirements.
Official references
- PostgreSQL 18: Table Expressions, joined tables
Qualified join row behavior and outer join semantics; all scenario data and repair examples are original READY exercises.